

| PROJECT HOMEPAGE | |
| |
| Safety Manual | |
| Media coverage | |
| Project Blog | |
|
|
|
|
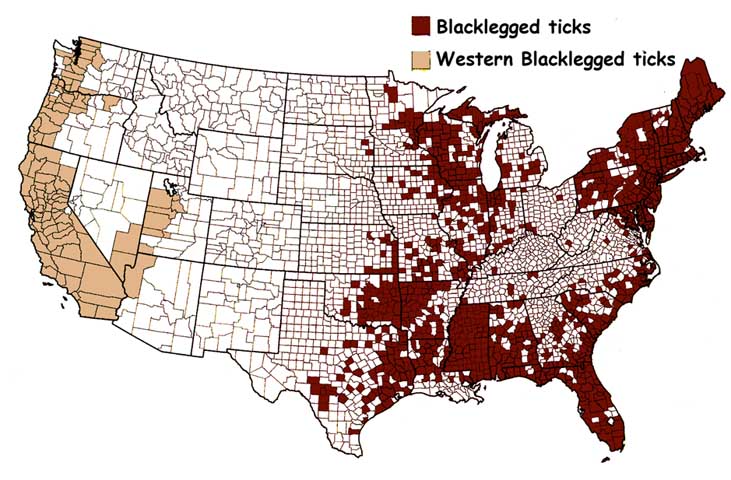
Mapping the national distribution of blacklegged ticks, back in 1998 Our version of the map combines the first two of the original's three catagories, which were: Dennis et al. (1998) acknowledged uneven sampling effort and other shortcomings in their mapped data, which were based on all published and unpublished county collection records available to CDC before 1998. Consequently, when the tick map was later used to help generate the CDC's national Lyme Disease risk map, a neighborhood analysis GIS procedure was used to modify the original tick distribution to smooth absent data and minimize the impact of reporting gaps. The modified map increased the number of counties containing I. scapularis and I. pacificus from 1,058 counties (34% of total counties) in the original data set to 1,404 (45% of total) in the modified version. Since 1998, the distribution of blacklegged ticks has explanded progressively - invasion of these ticks into new areas is one reason for increasing Lyme disease incidence nationally in the past decade. . Reference: |

